
TL;DR
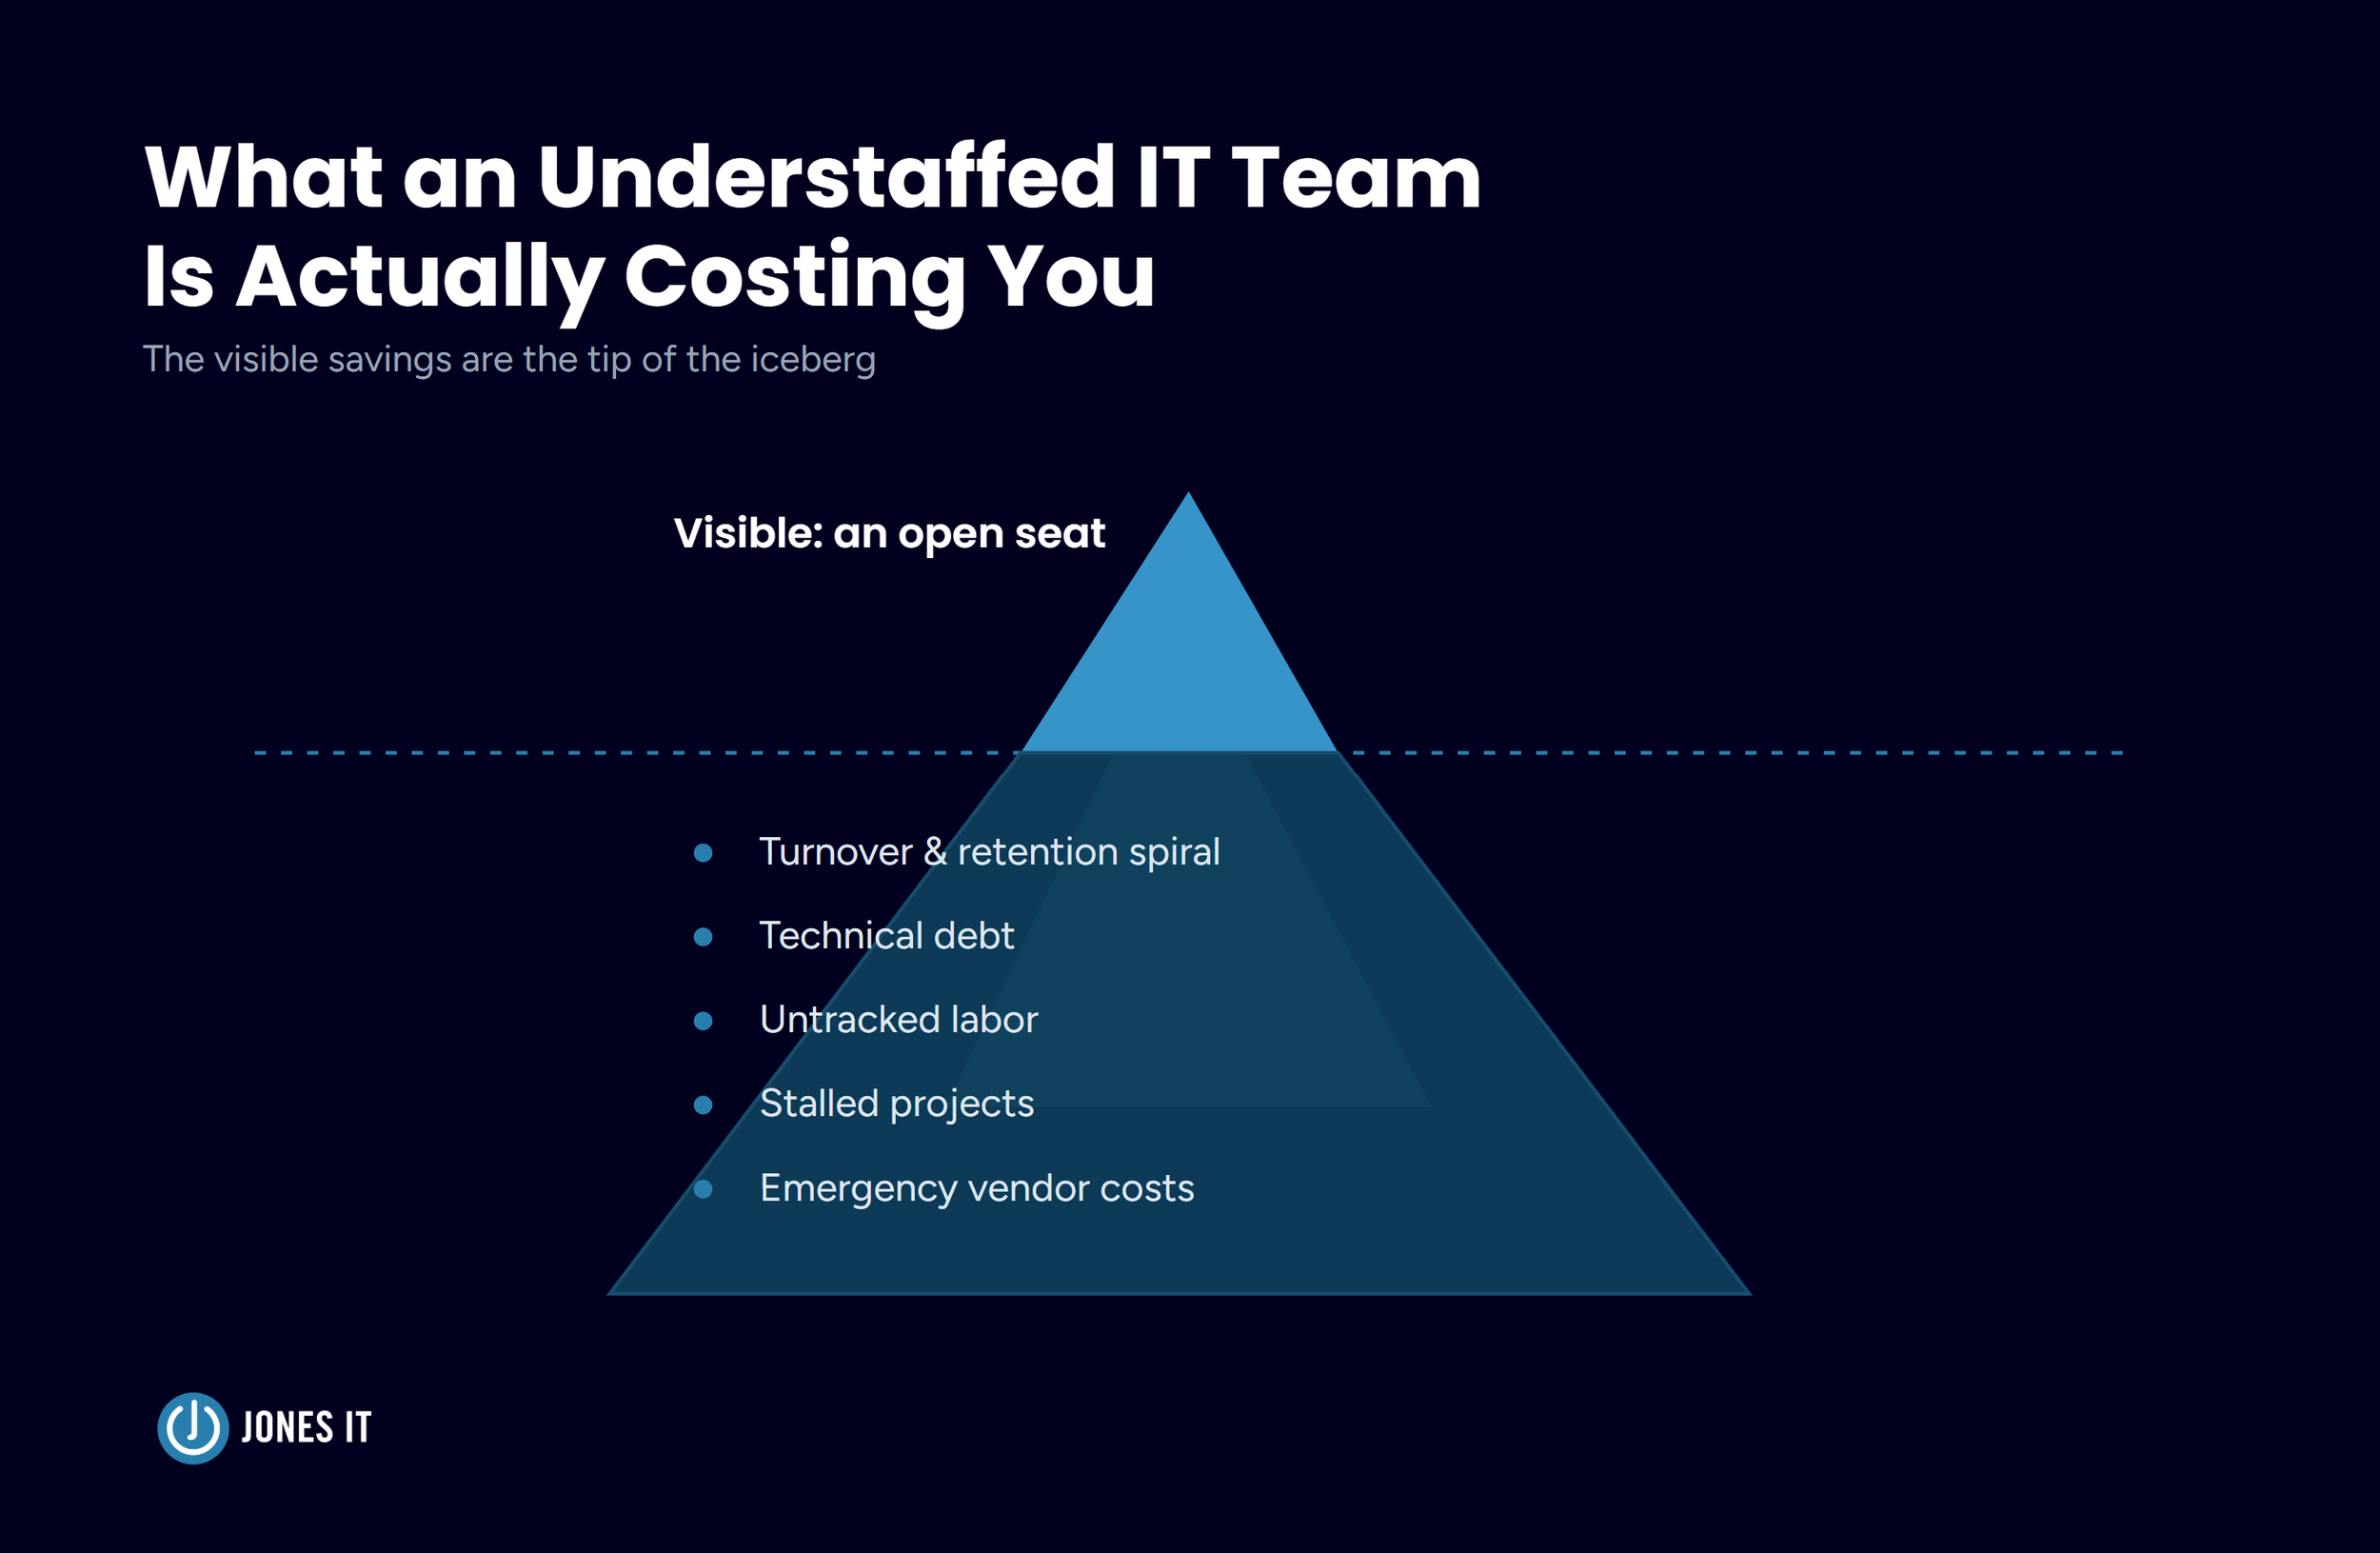
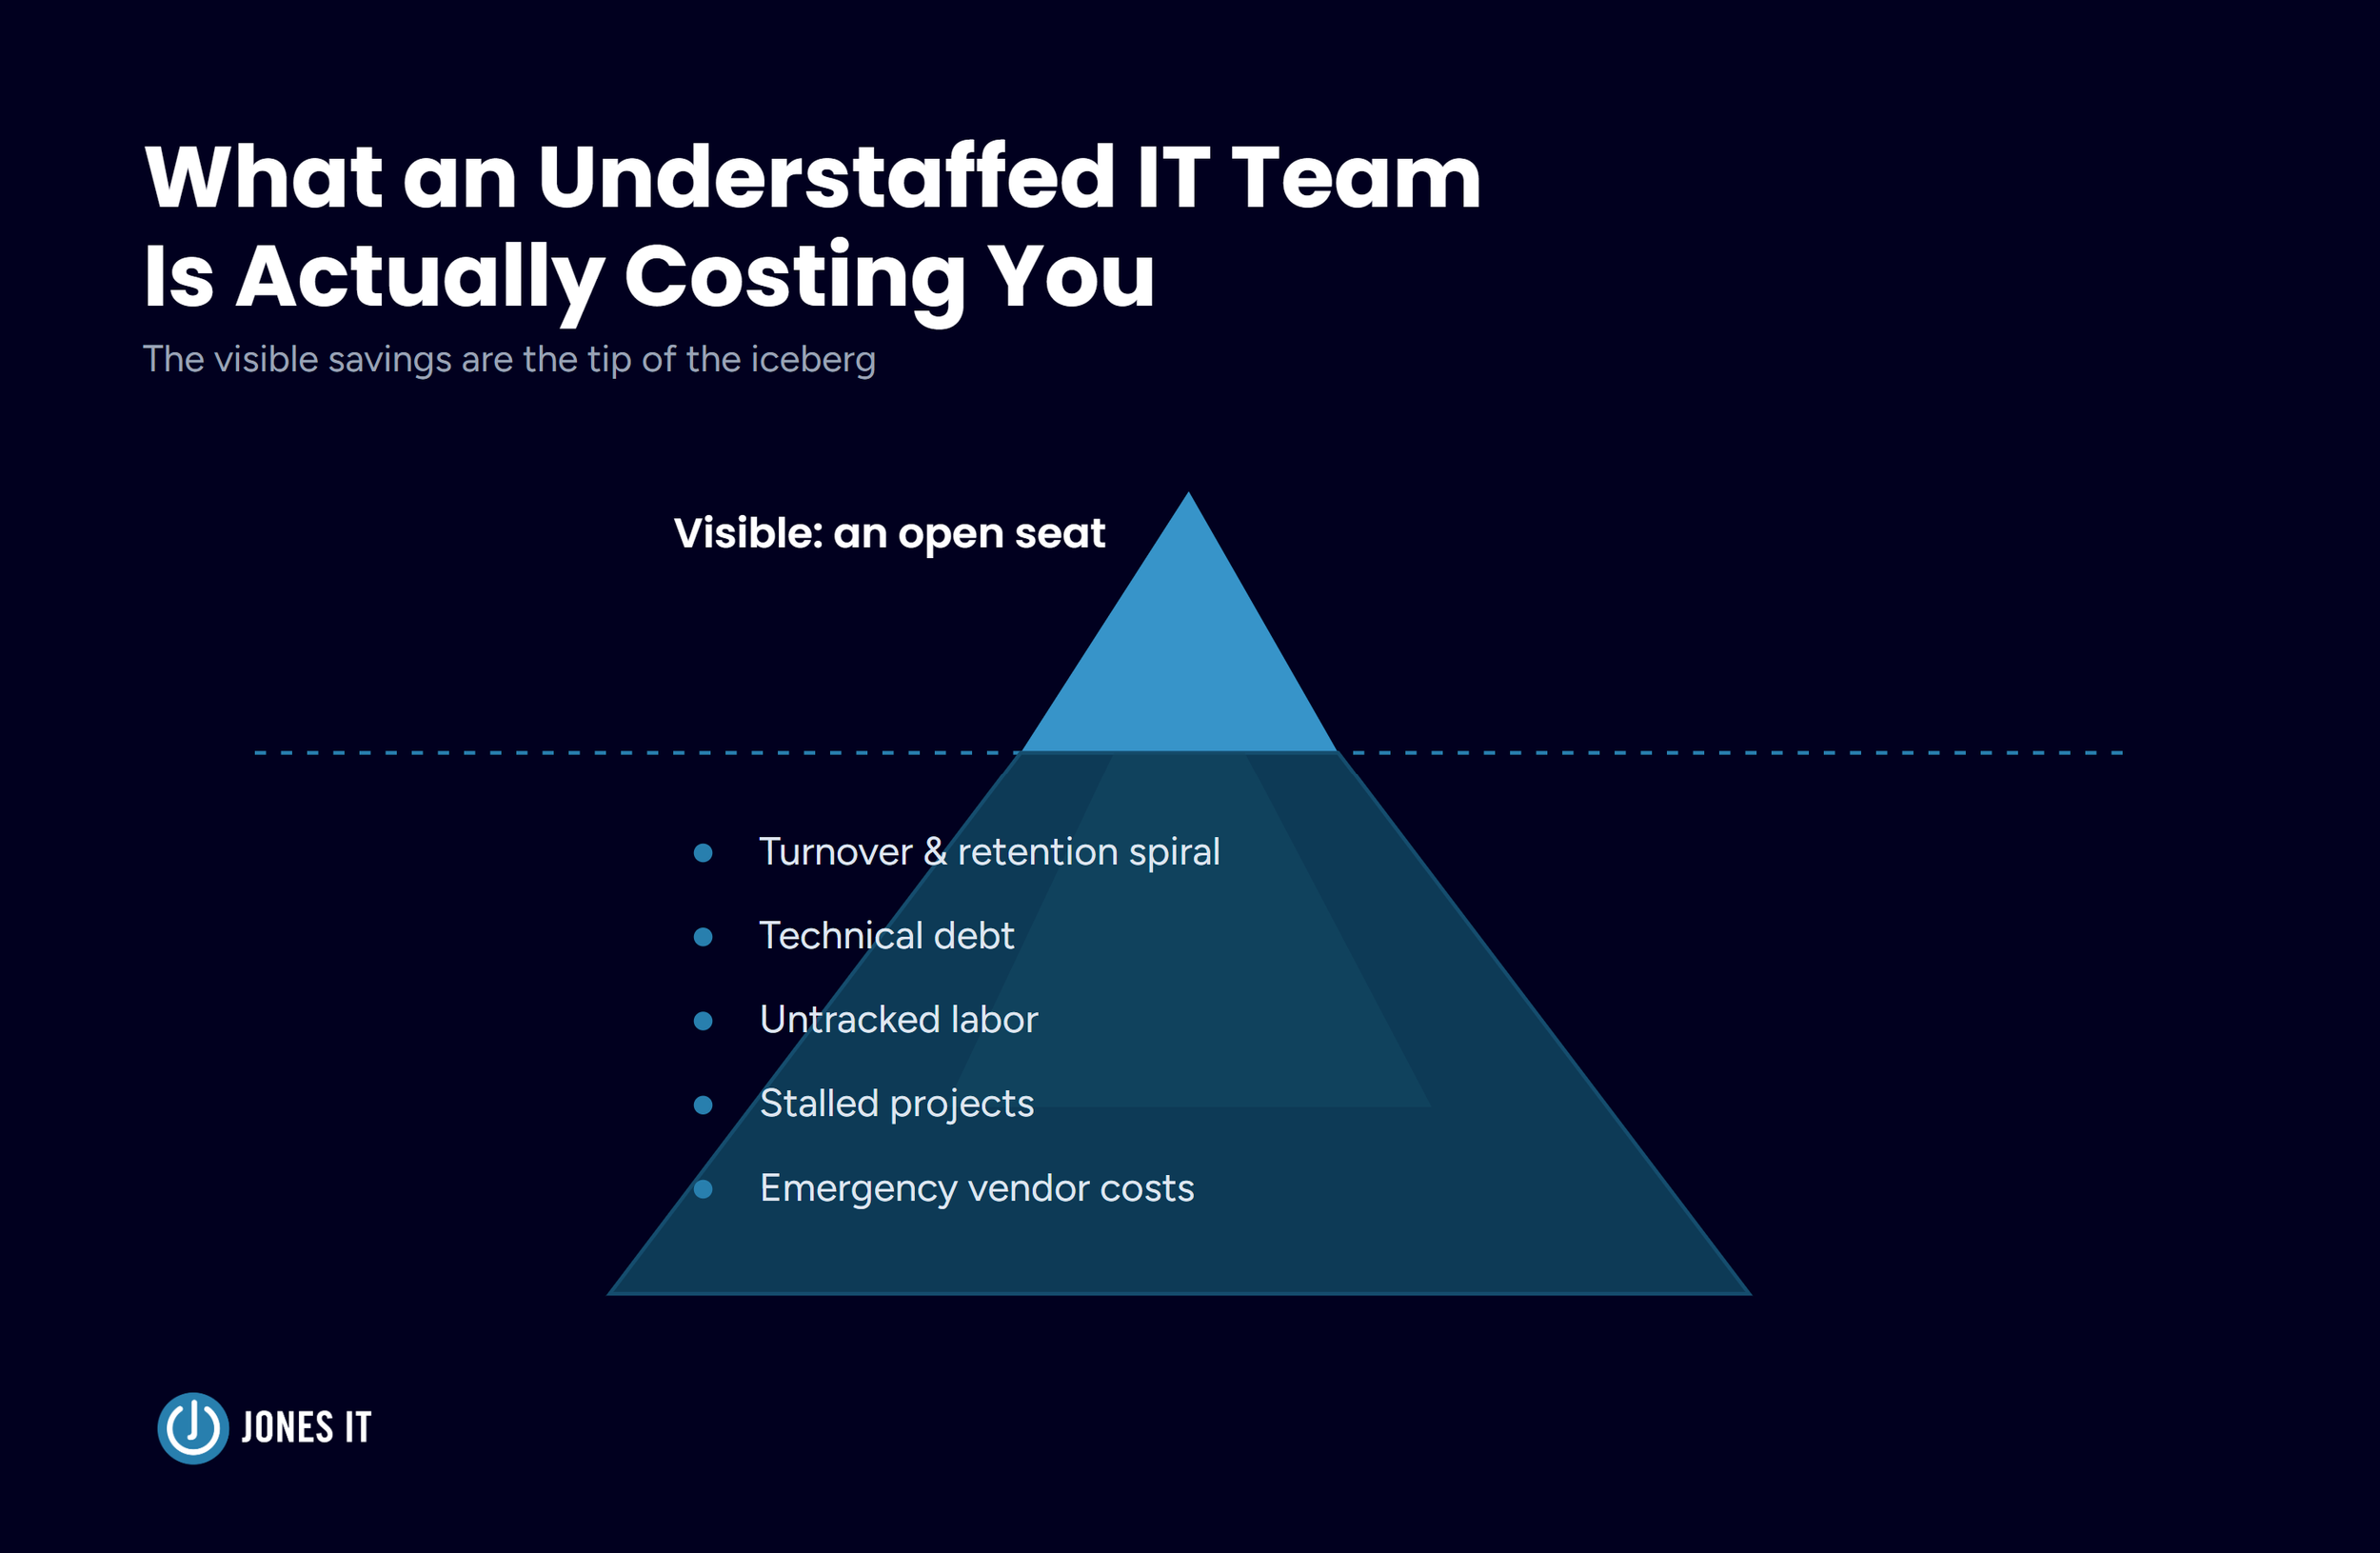
Leaving an IT seat unfilled looks like savings on paper. In practice, an understaffed IT team runs up a hidden bill in turnover, technical debt, stalled projects, and emergency vendor fees, one that's often larger than the salary of the hire you didn't make.
An East Bay Series B SaaS company's CFO pulled up her IT department's ticket volume before finalizing next year's budget. Low volume, she figured, meant the team had surplus capacity. Maybe even room to cut headcount. What the report couldn't show her was the forty or so requests that the IT manager was receiving every week that never became tickets at all: quick Slack pings, hallway favors, “can you just look at this real quick” during standups. The official number said the team had excess capacity. The real number, if anyone had counted it, would have shown the cost of an understaffed IT team already spilling into someone else's day.
We see some version of this at nearly every Series A and B company that comes to us. An open IT requisition is often treated as a deferrable line item, and the visible ledger (the vacant seat, the smaller payroll) can initially appear as savings. Often, however, an understaffed IT team doesn’t make those costs disappear; it just moves them.
Those costs show up in turnover, in infrastructure held together with shortcuts, in stalled projects, and in invoices nobody budgeted for. None of that appears next to "IT payroll" on a P&L statement; this invisibility can make these costs go unnoticed. We’ve made a version of this argument before about DIY IT management: what looks like the cheaper option on paper rarely stays cheaper once you count everything it’s quietly costing somewhere else.
We put a number on each of the places that cost moves to, because a vague warning about "hidden costs" doesn’t help anyone build a budget. Here’s what an understaffed IT team is actually costing you.
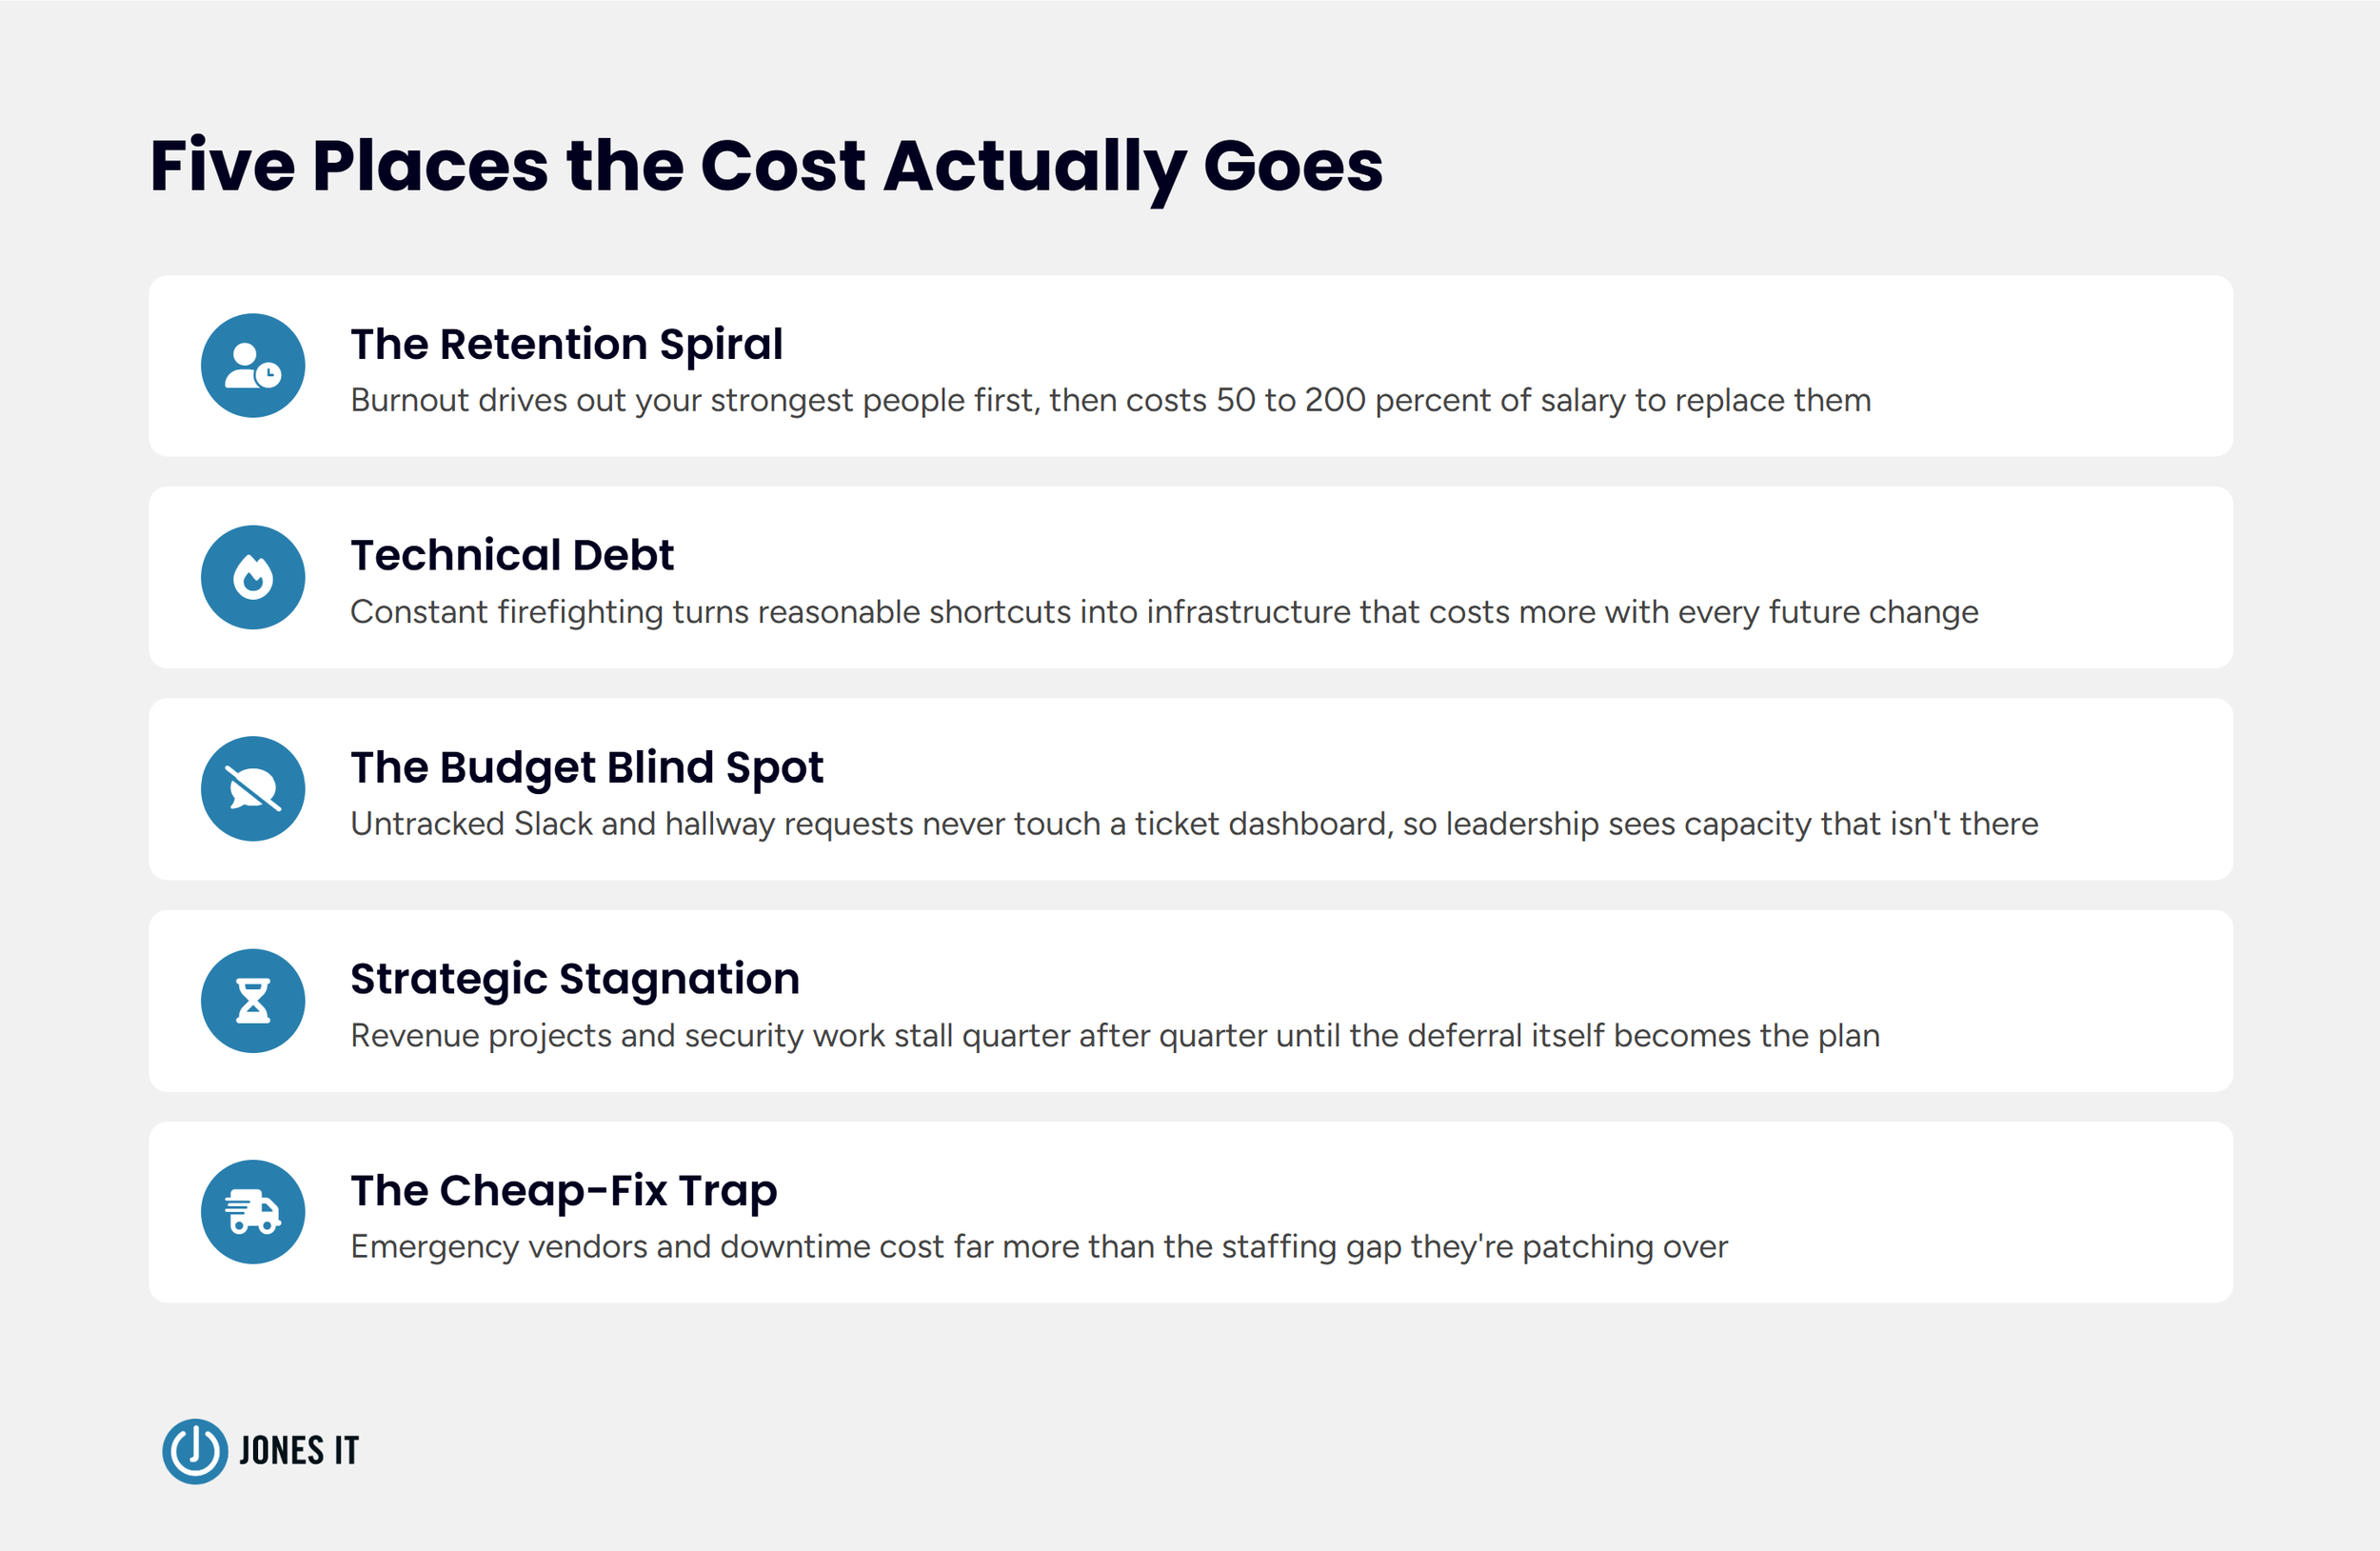
The Retention Spiral: Why Understaffing Increases IT Turnover Costs
When a team is short a person, the workload doesn’t shrink. It redistributes across whoever is left, and that redistribution rarely shows up on anyone’s dashboard. The engineer covering two roles keeps hitting deadlines for a while, because skilled people are good at absorbing pressure before they show it. That absorption has a name: burnout, and it rarely shows up on the outside until the person carrying it has already mentally quit the job. Then they leave, often for a role with the same salary, but without the extra workload attached.
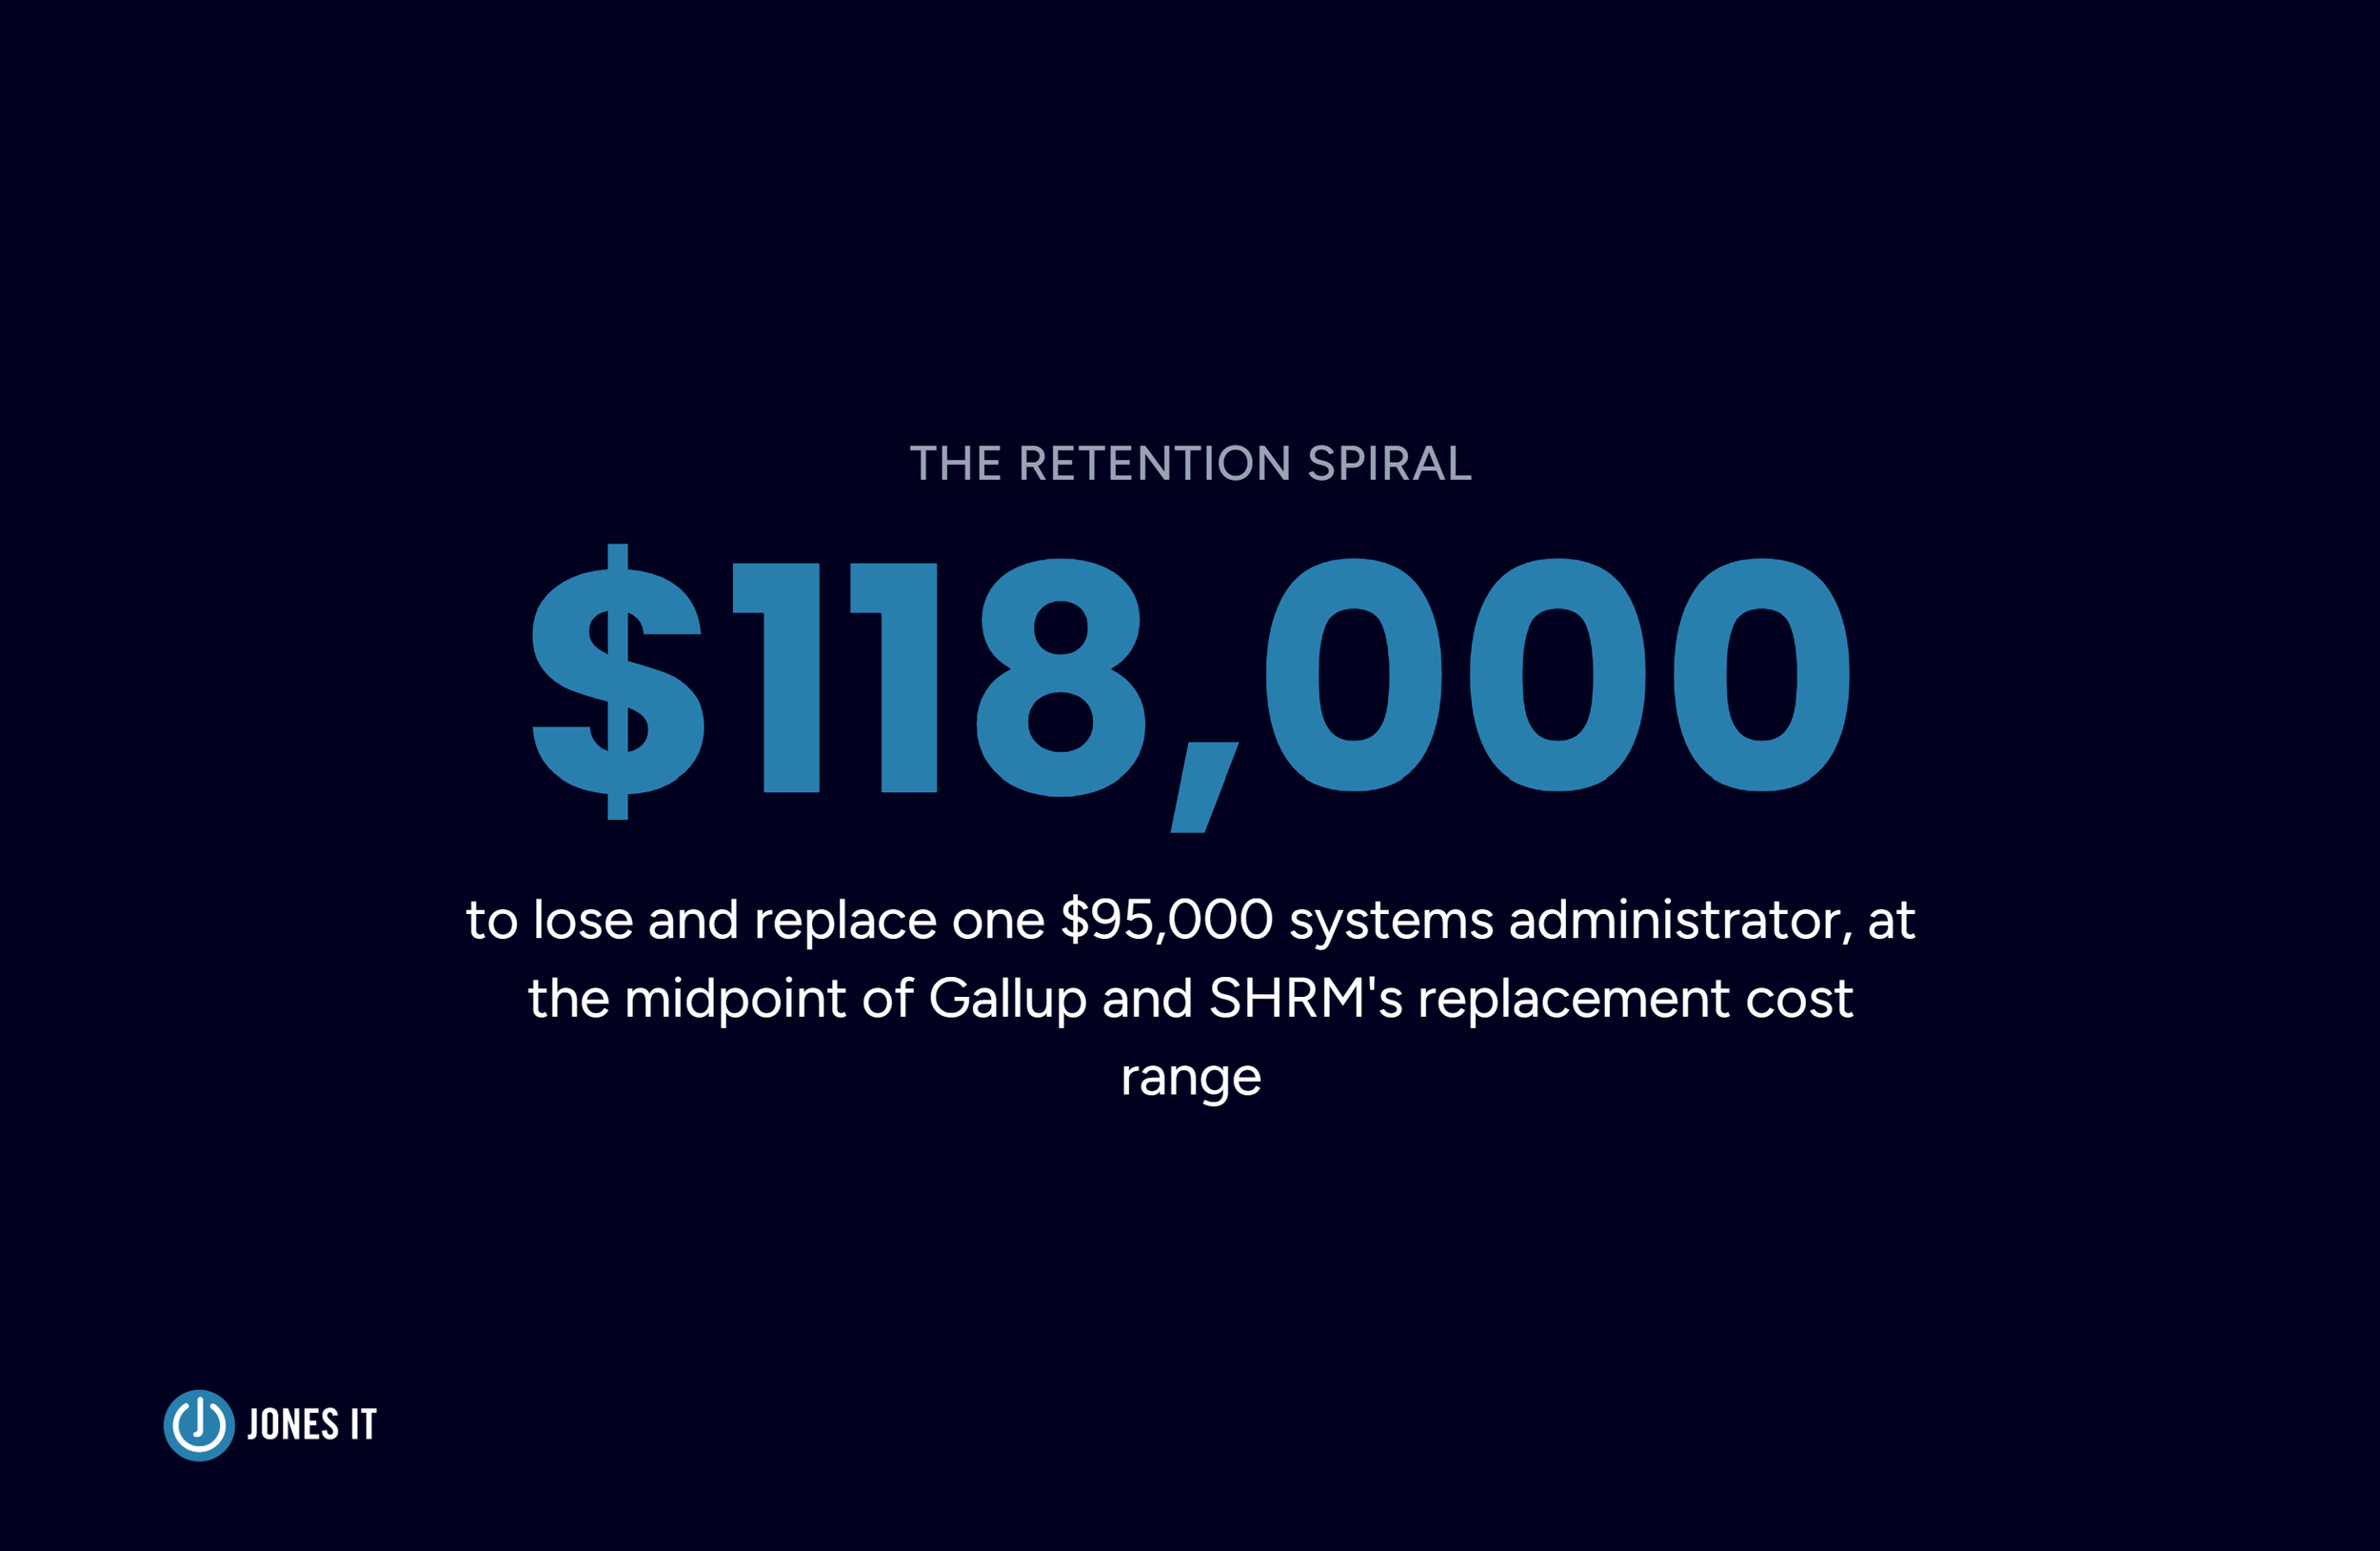
Gallup and SHRM both put the cost of replacing an employee at between 50 and 200 percent of that person’s annual salary, depending on seniority and how specialized the role is. For a systems administrator earning $95,000 in the Bay Area, the middle of that range, roughly 125 percent, works out to just over $118,000 to lose and replace one person: recruiting, onboarding, the productivity gap while the new hire ramps up, and the institutional knowledge that walks out the door with them. SHRM’s 2025 benchmarking puts the average cost per hire alone at $5,475 for a non-executive role, and that figure covers only the recruiting mechanics. It says nothing about the months of reduced capacity around it.
I’ve seen this pattern often enough to trust it more than most early warning signs: the first person to leave a stretched-thin IT team is rarely the weakest performer. It’s usually the strongest one, because they’re the person most in demand elsewhere and the least willing to keep absorbing someone else’s unfilled seat.
Once one departure happens, the remaining team absorbs even more of the load, and the spiral compounds from there. A company that loses two IT hires in a year to the same understaffing problem isn’t paying a one-time cost. It’s paying a recurring one, and the second departure usually comes faster than the first.
Technical Debt: How Reactive "Firefighting" Erodes IT Operational Efficiency
An understaffed IT team spends most of its time reacting. Tickets, outages, and one-off requests fill the calendar, and the deeper work, documentation, automation, infrastructure planning, gets pushed to whenever things quiet down; and things rarely quiet down.
The shortcuts a stretched team takes to keep pace compound with time. Servers are patched rather than properly upgraded because there is never time to plan the work. A workaround gets documented in someone’s head instead of the runbook because writing the runbook is the first thing to slip when three tickets are open at once. Each shortcut is individually reasonable, but together, they morph into technical debt, resulting in an infrastructure that works fine today but multiplies the cost and risk of every future change.
Technical debt doesn’t bill you directly, which is why it often obscures the true scale of your IT infrastructure costs and survives budget conversations that would, otherwise, kill a line item with a visible and significant price tag. It shows up instead as a migration that takes twice as long as it should, a security patch that can’t be applied cleanly because three other systems depend on the workaround built around it, or a new hire who spends their first month reverse-engineering undocumented decisions instead of doing the work they were hired for.
We wrote more on how this specific pattern compounds in our piece on managing technical debt in your IT infrastructure, and the short version holds here too: the debt is cheapest the day it’s created and most expensive the day someone finally has to pay it down.
The Budget Blind Spot: Why Untracked IT Requests Are Hidden Financial Liabilities
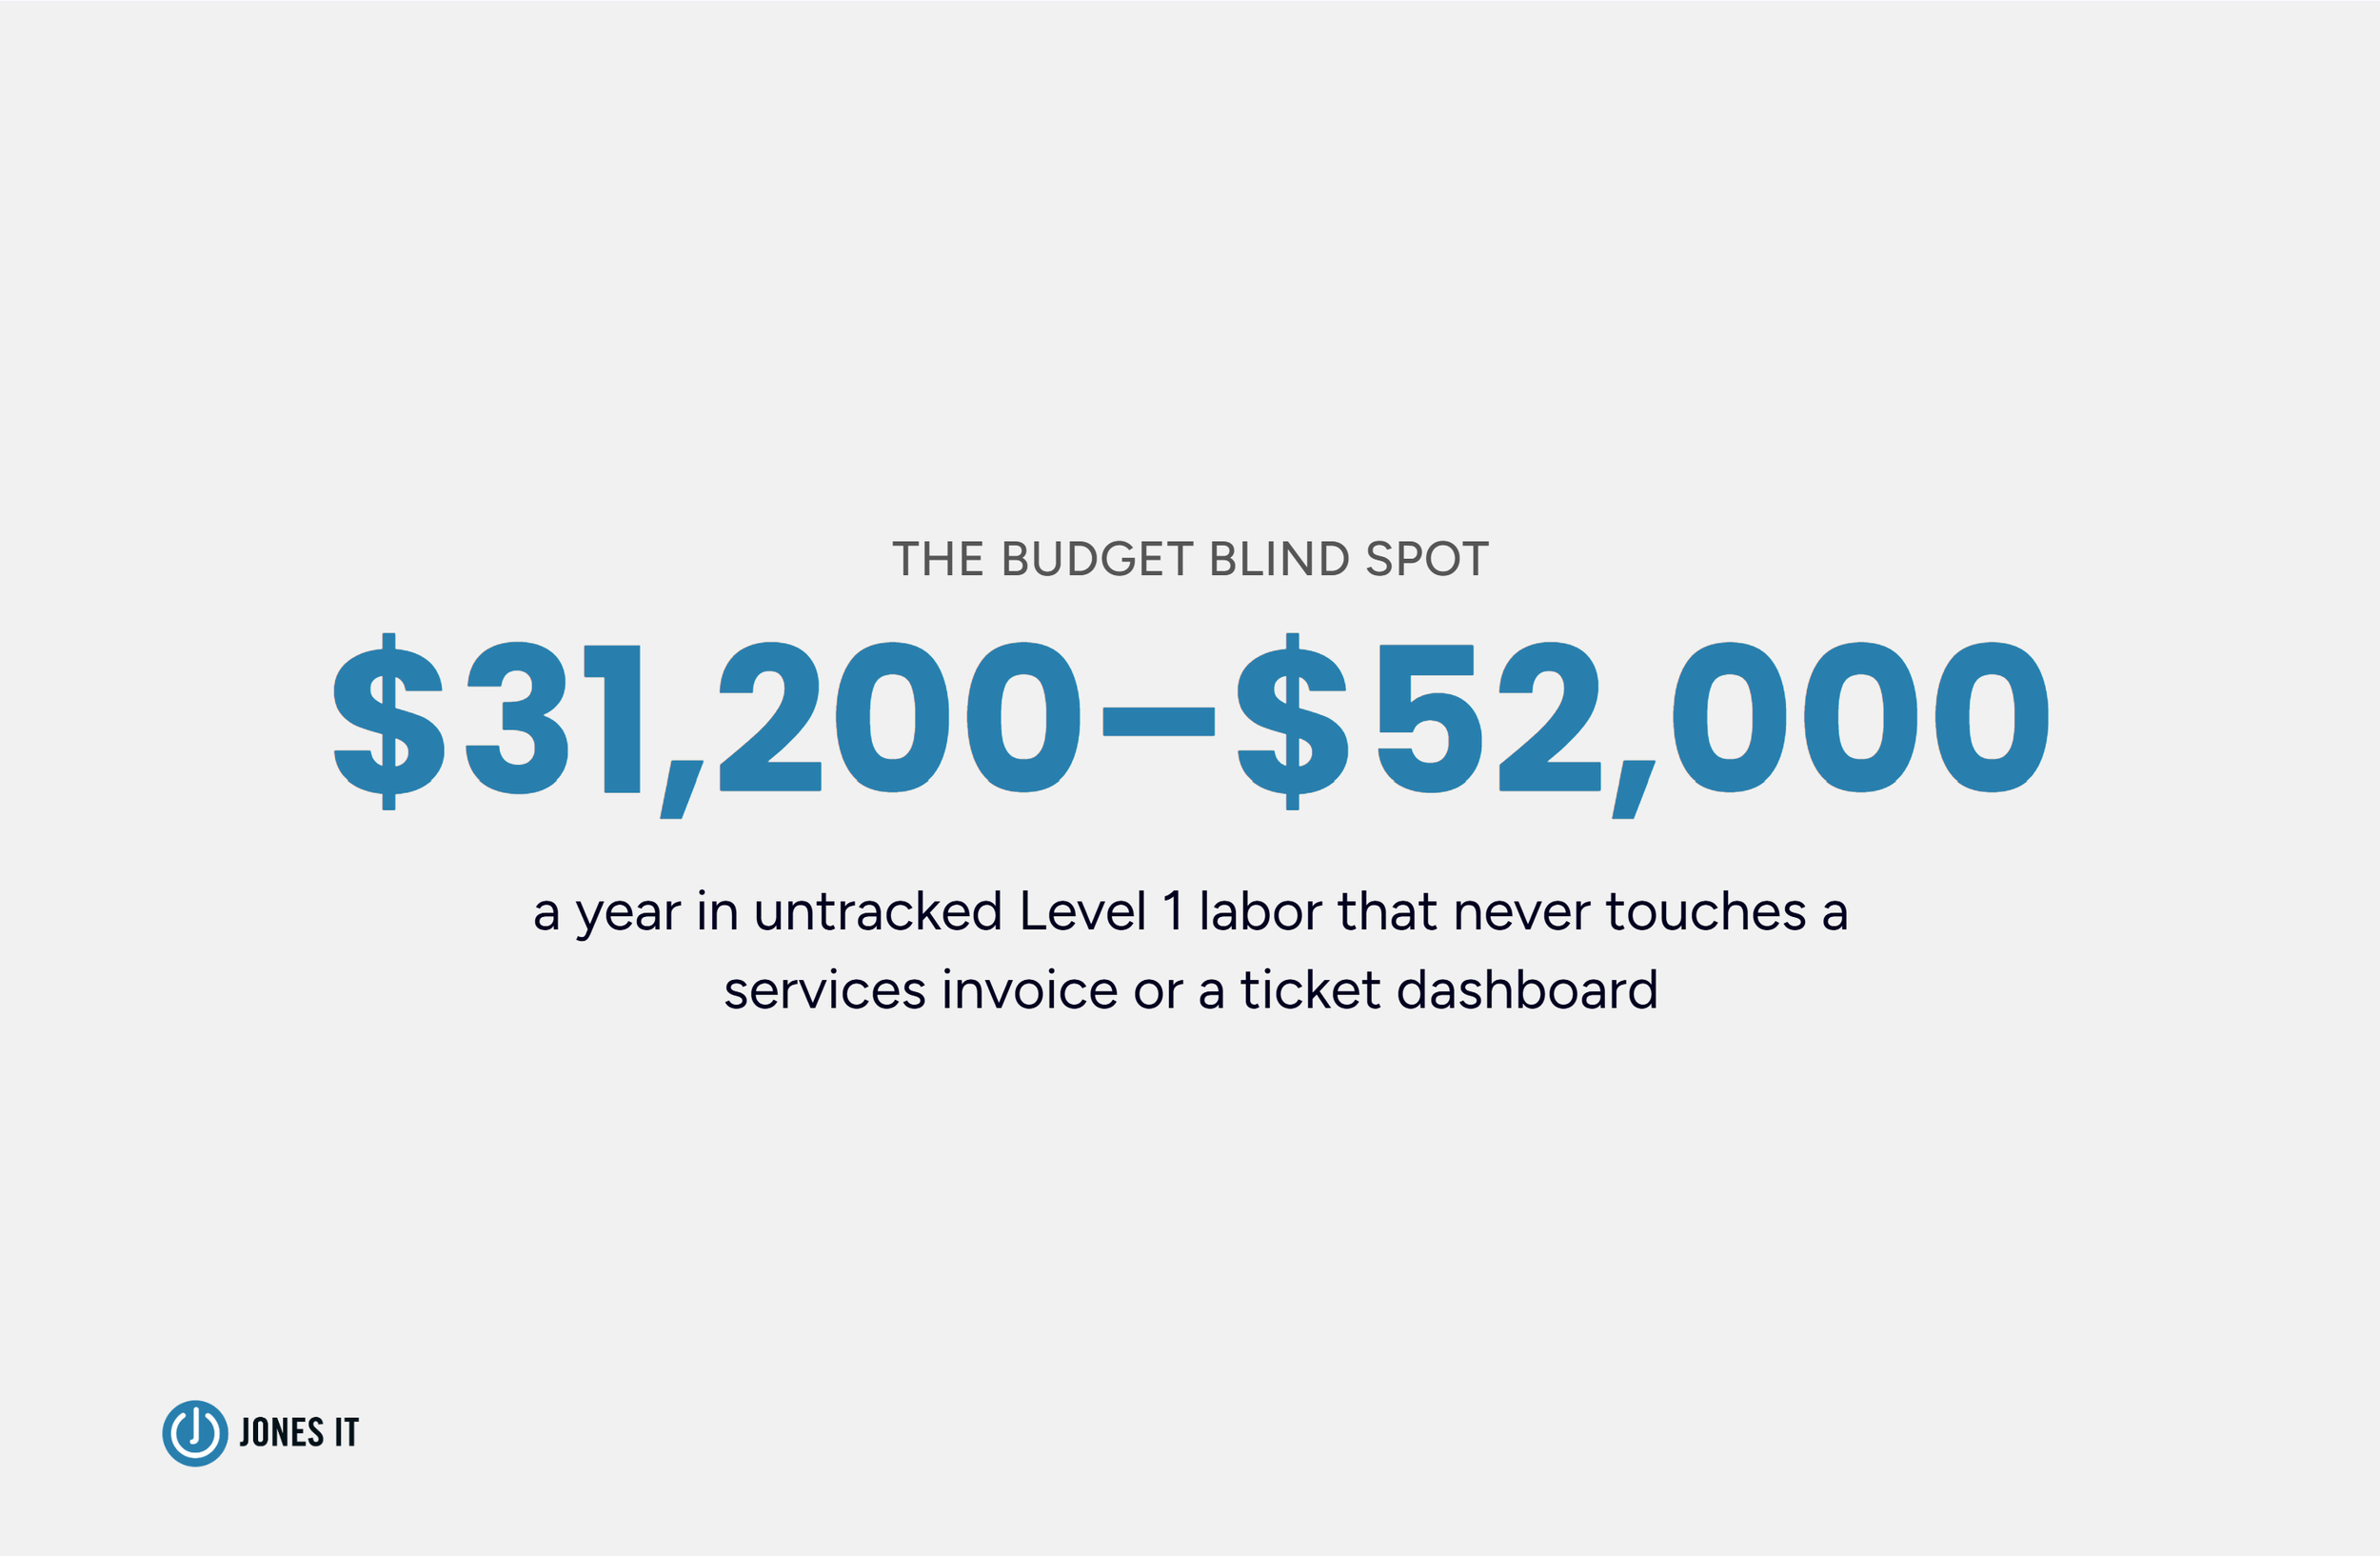
Let’s go back to the CFO from the opening. Handling 30 to 50 untracked Level 1 requests a week, at the Help Desk Institute’s industry benchmark of roughly $20 per resolved ticket, works out to $31,200 to $52,000 a year in labor that never touches a services invoice or a ticket dashboard. If those requests are landing on a senior engineer instead of a help desk technician, because that engineer happened to be the one free on Slack, the real cost per ticket runs considerably higher because a senior engineer’s hourly cost is well above what the ticket benchmark assumes. Additionally, every hour spent on a routine password reset is an hour not spent on the infrastructure work that the engineer was actually hired to do.
The gap between tracked and untracked work is a common blind spot when evaluating IT operational efficiency and headcount. A low official ticket count can sometimes be read as evidence that a department has capacity to spare. In many cases, however, that count actually measures how much work employees have learned to route around the ticketing system entirely, because pinging someone directly is faster than waiting in a queue. Low visible volume paired with an overworked team often suggests that the tracking system no longer fully reflects daily reality.
Strategic Stagnation: When IT Capacity Gaps Stall Revenue Growth
Every company planning a long-term business IT strategy on modern infrastructure has a backlog of initiatives that depend on IT bandwidth: a compliance framework due for a target close date; a cloud migration to cut recurring costs; or a security control likely to surface at the next board meeting. When the IT team is fully occupied keeping today’s systems running, those initiatives don’t disappear. They get deferred, quarter after quarter, until the deferral itself becomes the plan.
SHRM’s 2025 recruiting benchmarking data puts the average vacancy period for an unfilled role at roughly a month and a half, and every week inside that window is a week a dependent project doesn’t move. For a revenue-generating initiative, a delayed release, a stalled integration that a sales team was counting on to close deals, keep compounding the cost beyond the vacancy itself. A six-week delay on a project with real revenue attached rarely costs six weeks of that revenue. It costs six weeks plus whatever momentum and internal trust the delay burns along the way.
Security work is the most critical version of this problem. Patch cycles, access reviews, and vulnerability remediation are exactly the category of task that gets pushed when a team is in constant reactive mode, and exactly the category where a deferred task can turn into an incident. The cost of a missed patch window isn’t the patch; it’s whatever the patch was protecting against.
The Cheap-Fix Trap: Why Emergency Vendor Costs Outpace Managed IT Services
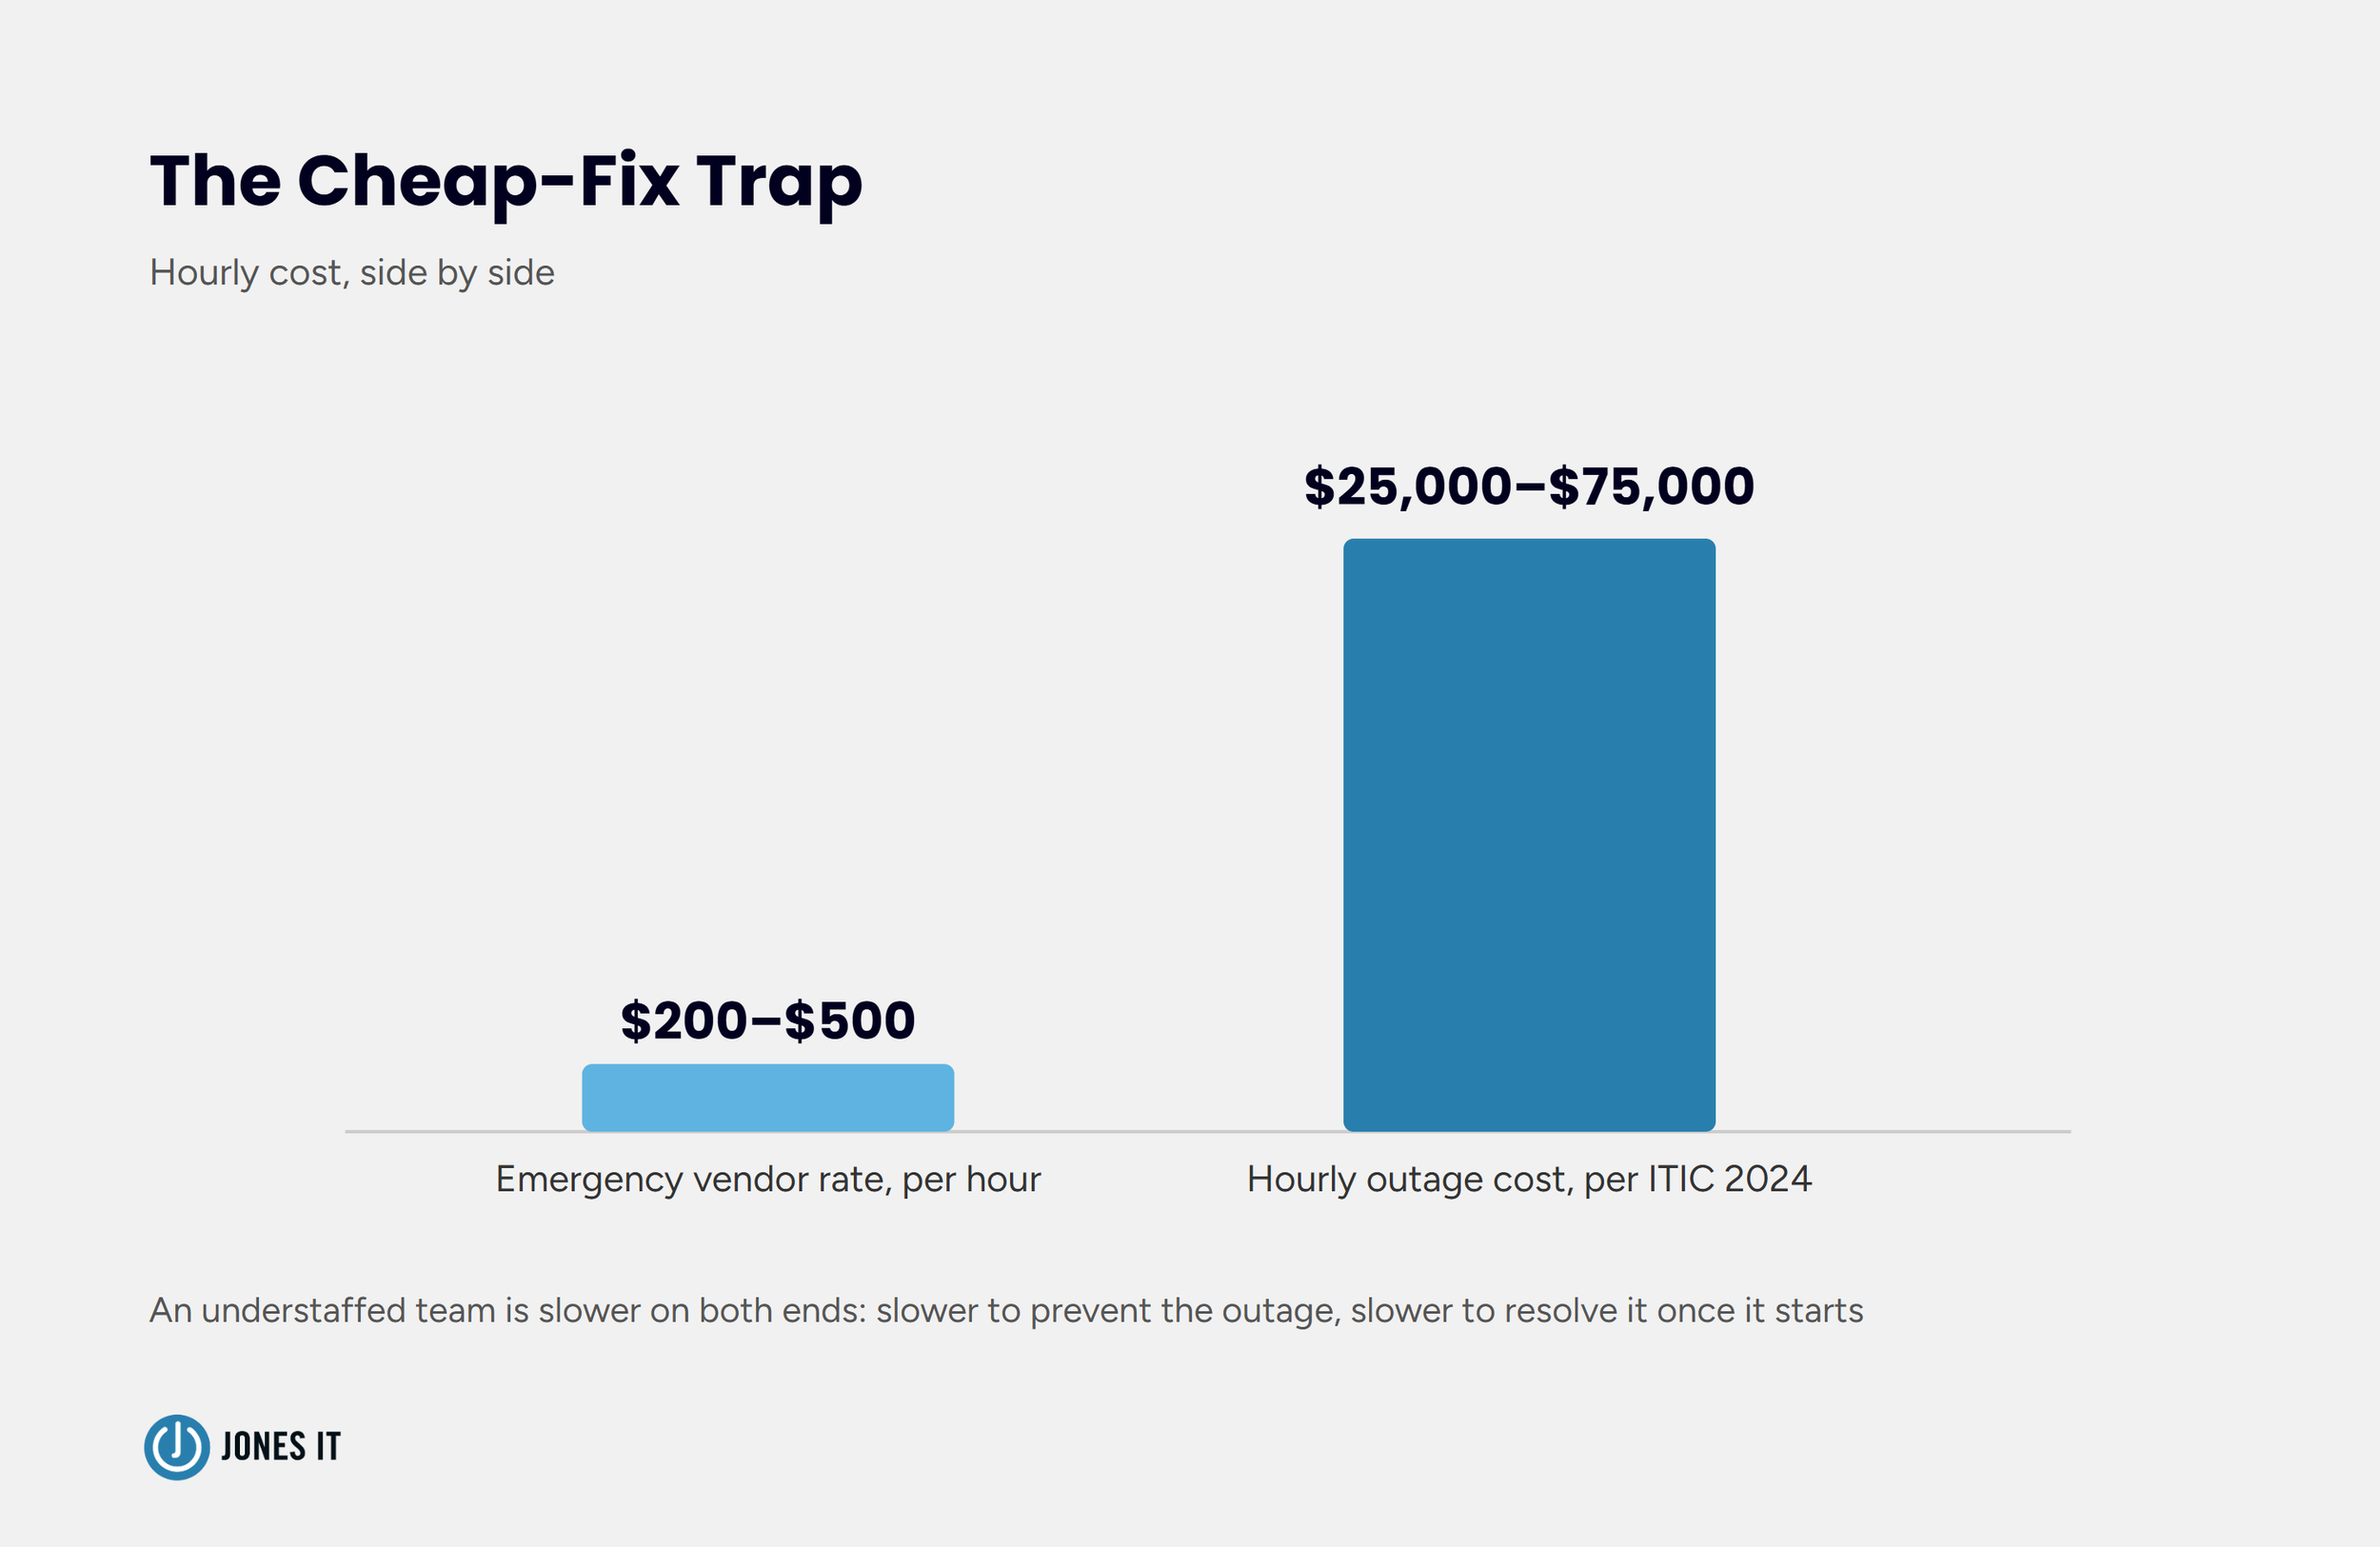
Understaffed teams solve immediate problems with whatever’s available, and what’s available is often more expensive than what proper staffing would have prevented. When an internal team can’t get to an issue fast enough, companies frequently bring in an outside vendor or a non-IT employee who happens to be technically inclined to patch things together. Industry pricing guides commonly cite emergency break-fix rates in the $200 to $500 per hour range for 2026, roughly two to three times normal managed service rates, and that premium buys speed, not a permanent fix. The double dispatch problem is very real, so you pay once for the emergency patch, then pay again later when it has to be done correctly.
Downtime sits behind all of this as the cost that makes every other number look small by comparison. The ITIC 2024 Hourly Cost of Downtime Survey found that for a small business, an hourly outage cost of $25,000 to $75,000 can be serious enough to threaten the company’s survival. That figure is scaled for the SMB size rather than the enterprise numbers that dominate most coverage of this topic, and it tracks with what we see in practice. An understaffed team isn’t just slower to prevent an outage, but also slower to resolve one once it starts, because there’s no bench to pull from when the one person who understands the affected system is already putting out three other fires.
Uncovering the True Cost of Your IT Staffing Gap
None of these costs will show up in a budget conversation unless someone deliberately puts them there. A few ways to start:
Track untracked work. Inviting your IT team to log direct Slack, Teams, or email requests for two weeks can be enlightening. Tracking this often reveals a significant gap between these informal requests and the official ticket count.
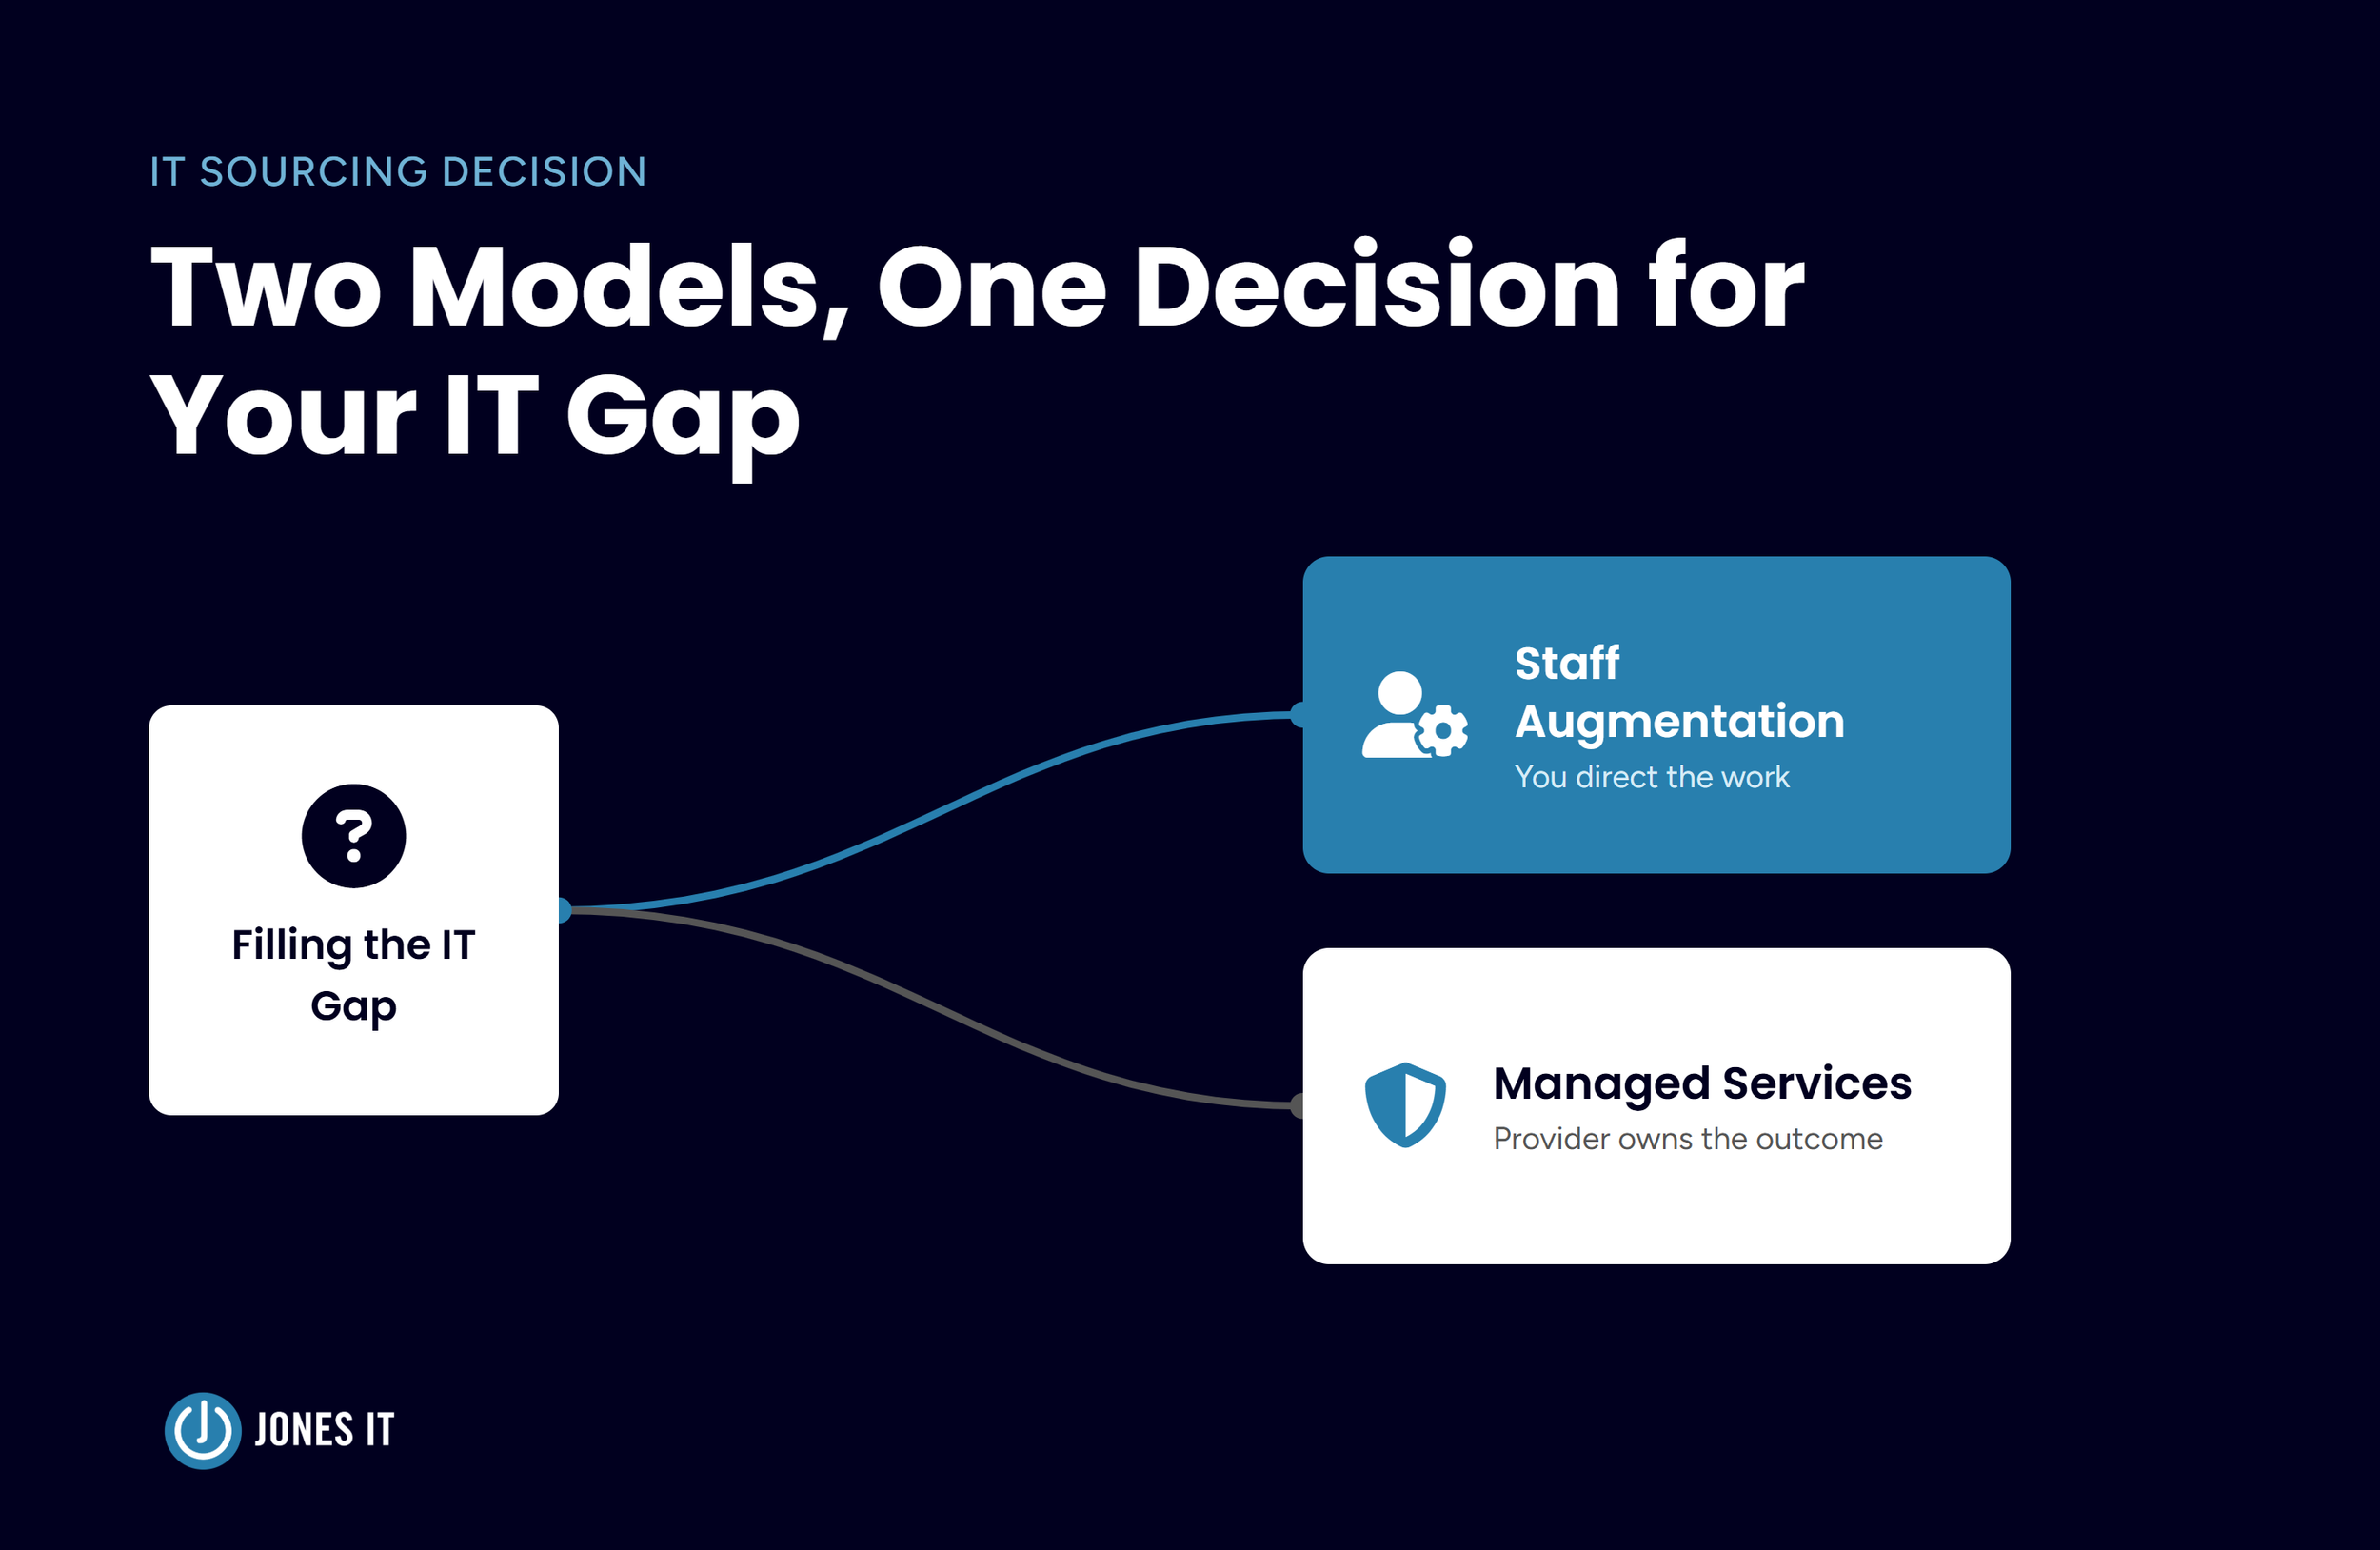
Calculate your actual replacement cost. Take your highest-risk IT role’s salary and run it against the 50 to 200 percent Gallup and SHRM range. The number usually reframes the conversation about headcount faster than any qualitative argument does. Run it against alternative staffing models like Managed IT services too, since a straight rehire isn’t always the cheapest way to close the gap, as we cover in IT Staff Augmentation vs Managed Services.
Audit the backlog for deferred security work. A list of patches, access reviews, or audits sitting untouched for more than a quarter is a specific, dated liability, not an abstract risk.
Price out your last emergency vendor call. Compare that invoice to what a properly staffed or supported team would have spent preventing the same issue.
Put technical debt on the roadmap, with a scheduled slot of its own. Without a dedicated roadmap slot, technical debt often accumulates over time rather than being addressed.
Moving Toward a Sustainable IT Staffing Strategy
The CFO we mentioned in the beginning of this post ran her own version of this exercise once she saw the untracked-ticket math laid out next to her official volume numbers. The open IT requisition she’d been planning to defer turned out to be the cheaper option once she compared it against what the gap was already costing her in Slack-routed labor, in a senior engineer’s diverted hours, and in the security work that kept sliding to the next quarter.
This pattern exists in almost every version of this story. The line item on the budget looks like the cost, but the actual cost is everywhere else. It is spread across turnover, technical debt, untracked labor, stalled projects, and emergency invoices, none of which get attributed back to the staffing decision that caused them. Once you put a number on each of those places, the math tends to argue for itself.
If your team is already stretched thin enough that a new hire feels overdue, closing the gap doesn’t have to wait on a full hiring cycle. We’ve written about how to close those gaps with co-managed IT while you sort out whether a new hire, an augmented team, or something else is the right long-term fix.
You don’t have to do this math alone. If you want a second set of eyes on what your current IT staffing gap is actually costing you, we can help. Reach out to Jones IT, and we’ll run a capacity analysis against your specific team and infrastructure so you have the data you need for your next budget review.


About The Author

Evan JonesFounder and CEO of Jones IT
With over two decades of IT experience in San Francisco, Evan guides Jones IT's long-term strategy, finances, and culture, with a vision of building the city's highest-rated IT services firm. Outside of work, you'll find him on the golf course or running Bay Area Warriors, his non-profit connecting Bay Area kids to college through basketball.
Learn how IT support for VC firms works best as a shared baseline. Protect your portfolio companies without adding a central help desk operational burden.